
GIS Territory Management for Franchise Ops
Overview
JD's community retail stores are franchised convenience stores focused on fresh produce in residential areas. The core business model is T-1 ordering — customers order one day in advance, enabling precise supply chain management to solve the "last-mile" delivery challenge for fresh products.
The existing platform allows different management levels to oversee performance and daily operations. However, as JD’s franchise retail network expanded across multiple cities, territory planning became increasingly hard to manage. Teams relied on spreadsheets to draw and update service areas — leading to duplicated work, missing regions, and wasted time.
Therefore I partnered with a product manager and a UI designer to built a map-based Grid Management System that enables teams to visualize, edit, and approve service boundaries on an interactive map. It supports multi-level management, approval workflows, and performance tracking, helping HQ, city managers, and regional teams coordinate seamlessly.
Timeline
2022 Q1
Genre
B2B SaaS
Tools
Sketch
Team
Product Manager

UX Designer
UI Designer
My contribution
Reduced map creation time by 60%
Enabled fast business expansion from 8 to 20+ provinces
Designed scalable system serving 3,000+ users across 4-level hierarchy
Built foundation that became core infrastructure for new subsidiary
Project Background
Business Context
JD's community retail stores are franchised convenience stores focused on fresh produce in residential areas. The core business model is T-1 ordering — customers order one day in advance, enabling precise supply chain management to solve the "last-mile" delivery challenge for fresh products.
As the network scaled, our BD teams are using a management platform to manage franchise store coverage areas and coordinate supply needs across different service zones.

Design Challenge
"Our BD teams spend 2-3 hours daily planning operation area, but many neighborhoods remain uncovered."
BD Manager
The existing workflow had critical gaps:
01
Low Efficiency
Service area plan 2-3 hours per session
Neighboring BDs cannot collaborate on area division
02
Lack of Visualization
No intuitive view of store coverage areas
Unable to identify coverage gaps
03
Collaboration Chaos
No draft state management
Multi-user editing caused data conflicts and overwrites
04
Opaque Process
No approval workflow mechanism
Changes were disorganized
Approval progress not visible or trackable
System Map: Roles & Needs
After analyzing the current workflow gaps, I collaborated with the product manager to identify the main user groups of the project and clarify their goals and needs.
User Roles & Responsibilities

BDM - City Manager
Responsibility
Strategic planning and oversight for city-level grid coverage
Tasks
• Review city-wide coverage metrics
• Approve grid changes from regional teams
• Plan expansion strategy
Pain Points
• Can't see the big picture in Excel spreadsheets
• Approval requests lack context
• No visibility into approval status

BD - Regional Manager
Responsibility
Execute grid division for specific districts/neighborhoods
Tasks
• Conduct field surveys
• Draw and edit grid boundaries
• Submit grids for approval
Pain Points
• Manual drawing extremely time-consuming
• Can't save work-in-progress (no draft state)
• Don't know if others are editing the same area
• Must resubmit everything if rejected

Franchise Owner / Agent
Responsibility
Fulfill orders within assigned service area
Tasks
• Check assigned service area
• Fulfill daily orders
• Report operational metrics
Pain Points
• Unclear about precise service boundaries
• Boundary disputes with other owners
• Don't know population/demand in their area
Stakeholder Hierarchy & Information Flow
After gaining a detailed understanding of each user’s individual needs, I took a step back to look at the bigger picture — analyzing the overall business logic of the entire business unit and clarifying the roles each person plays in the workflow.

HQ Business Planning
(Final Approval)

BDM - City Manager
(Tactical Approval + Data Access)

BD - Regional Manager
(Grid Assignment)

BD - Regional Manager
(Grid Assignment)

Franchise Owner / Agent
(Service Delivery)

End Customers
Strategic directives, final approvals
Approval decisions, rejection reasons
Service area assignments, coverage maps
Grid change requests, new grid submissions
City expansion plans, approval batches
Daily sales data, inventory status
Boundary coordination, area clarification
Use Case Analysis
Through analyzing user journeys across all three roles, I identified a key insight: many use cases are similar across roles, but with different information needs and permission scopes.
Instead of building separate interfaces for each role, I designed a unified feature architecture where:
Analyzed use cases across BDM, BD, and Franchise Owners
Merged similar use cases into shared features
Designed adaptive UI that adjusts based on user role
Implemented permission layer to control what each role can see and do
Use Cases
Login
View Coverage
Identify Needs
Create/Edit Grids
Save Draft
Submit for Approval
Review Submission
Approve/Reject
Track Status
View Results
BDM
(City Manager)
• Login to system
• Access city-level dashboard
• View city-wide grid map
• Toggle heatmap mode
• Check coverage metrics
• Identify coverage gaps
• Spot high-density uncovered areas
• Export gap reports
(Cannot create/edit)
(N/A)
(Cannot submit)
• Receive notification
• Review change details
• View before/after comparison
• Approve or reject
• Add approval comments
• Set priority level
• View all team submissions
• Check approval history
• Monitor performance
• View updated city coverage
• Export coverage reports
• Plan next expansion
BD
(Regional Manager)
• Login to system
• Access district dashboard
• View district-level map
• Toggle draft/official view
• Check adjacent grids
• Identify areas needing coverage
• Check field survey data
• Select target area
• Use creation tools:
- Street combination
- Grid merge
- AOI picker
- Freehand draw
• Edit existing grids
• Auto-save as draft
• Continue editing multiple grids
• Review draft list
• Select multiple drafts
• Batch validate
• Submit for approval
• Receive confirmation
(Cannot review others' submissions)
(Cannot approve)
• Check own submission status
• View rejection reasons
• Receive notifications
• View approval results
• See published grids
• Revise if rejected
Franchise Owner
• Login to system
• Access personal dashboard
• View assigned grid only
• Check service boundaries
• See neighborhood details
• Understand service area
• Check population metrics
(Cannot create/edit)
(N/A)
(N/A)
(N/A)
(Cannot approve)
(N/A)
• View final service area
• Check assignment updates
• View supply schedule
Core Feature
Authentication
Map View
Analytics Menue
Status Tracker
Reporting System
Grid Creation Toolkit
Draft Management
Submission System
Approval Dashboard
Approval Workflow
Permission
• Role-based access
• Data scope by region
• BDM: City-wide
• BD: District-level
• Owner: Grid-level
• BDM: All metrics
• BD: Own region
• Owner: Own grid
• BDM: None
• BD: Create/edit in assigned region
• Owner: None
• BDM: None
• BD: Own drafts
• Owner: None
• BDM: None
• BD: Submit own drafts
• Owner: None
• BDM: View all
• BD: None
• Owner: None
• BDM: Approve/reject all
• BD: None
• Owner: None
• BDM: All submissions
• BD: Own submissions
• Owner: None
• BDM: City reports
• BD: District reports
• Owner: Grid report
Design Contribution
Added heatmap toggle
Quick Creation Tools
Street combo, grid merge, AOI picker
Auto-Save
Highlighted changes
For a better context
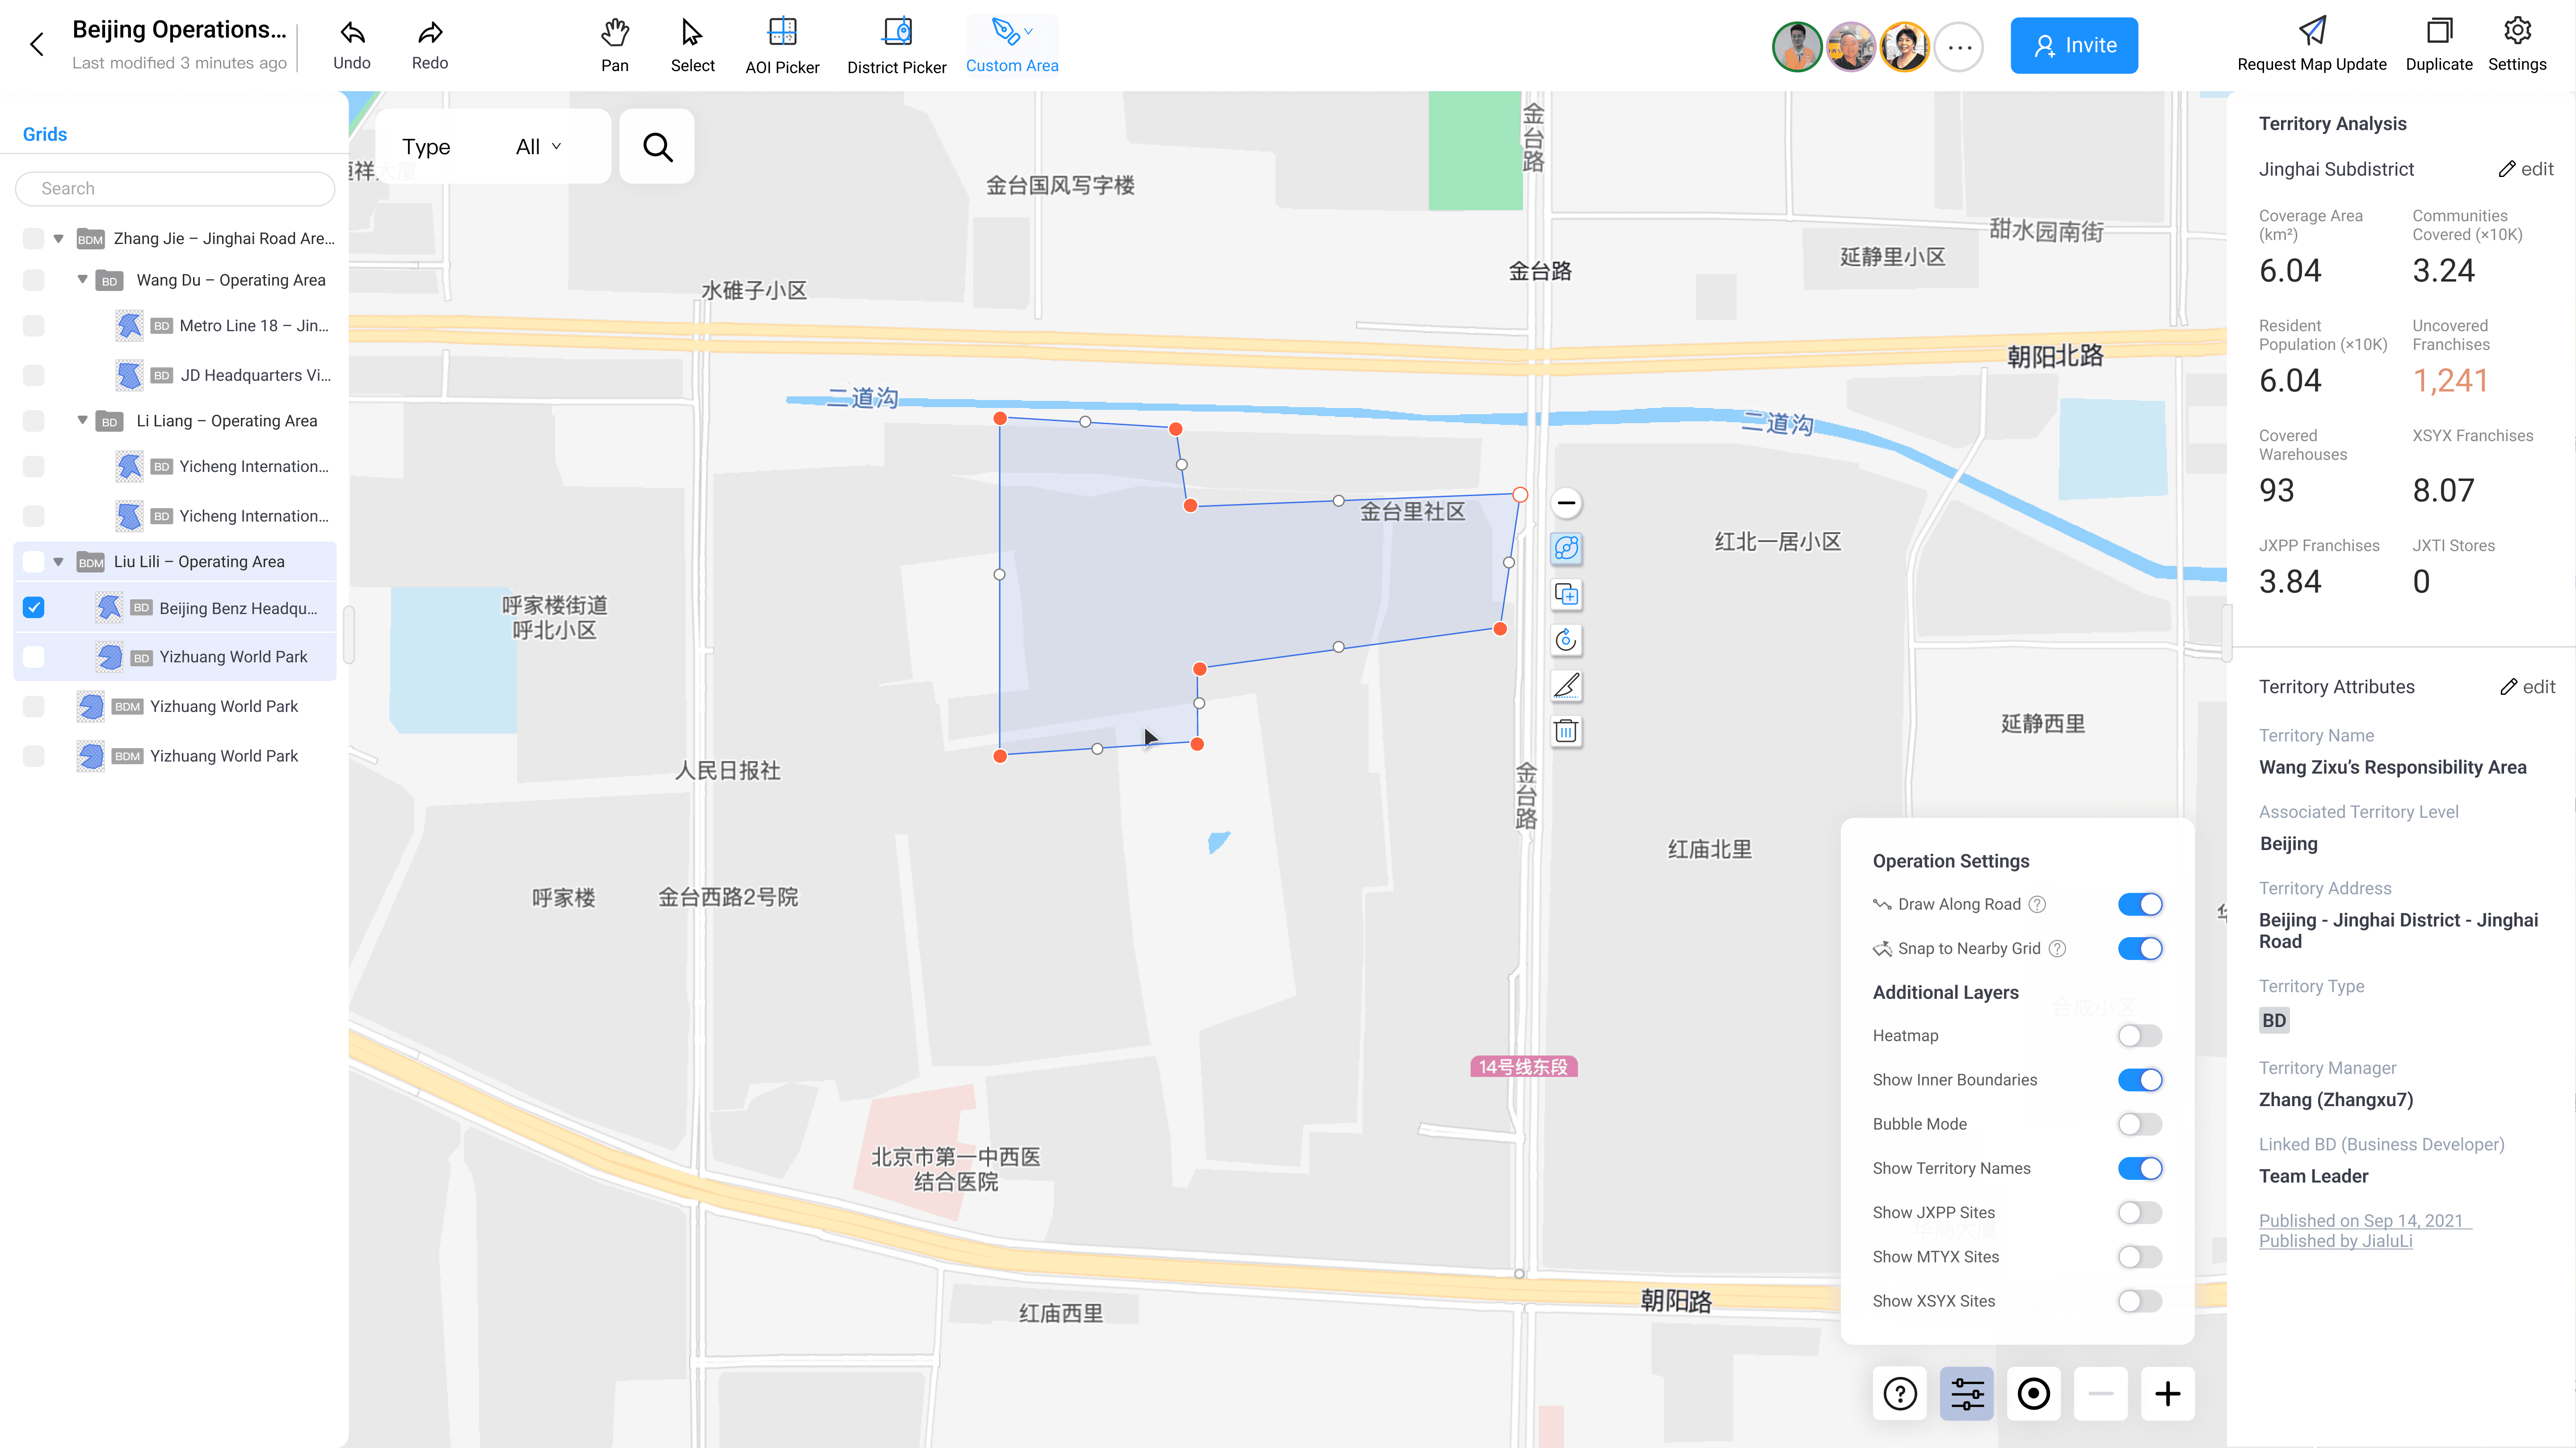
Solution 1: Strategic Coverage View (BDM)
Maps to Blueprint: Step 2 (View Coverage) + Step 3 (Identify Needs)

BDM - City Manager
View over all team performance: grid metrics (right sidebar) including area, population, coverage rate
View individual team member’s performance: filter by type (top filters)
Analyze competitor coverage and area population density: Overlay heatmap or competitor distribution filters (bottom-right layer controls)

Solution 2: Grid Editing Interface with Quick Tools
Maps to Blueprint: Step 4 (Create/Edit Grids)

BD - Regional Manager
To reduce manual drawing time and learning curve, I designed automated creation tools that eliminate tedious tracing.
Creating new areas:
AOI Picker: Click to select POIs
Freehand Drawing: Click vertices or drag to draw, with optional "Draw align road" that auto-snaps to street boundaries
Admin Boundary Import: Click to select government districts
Editing existing areas:
Grid Merge: Combine multiple grids
Grid Split: Divide one grid into sections
Solution 3: Approval Dashboard - Before/After Comparison
Maps to Blueprint: Step 7-8 (Review Submission + Approve/Reject)
BDM - City Manager
When BDM receives a map update request, clicking the notification opens the request map with
Review changes & make decisions: visual change highlights. The interface uses color-coded overlays to provide full context in approval decisions.

Solution 4: Draft Management
Maps to Blueprint: Step 5 (Save Draft) → Step 6 (Submit) → Step 7 (Review)
BDM - City Manager
Manage team activities
Review map update request
BD - Regional Manager
BD collaboration: Multiple team members can work on drafts simultaneously
Draft operations: Delete outdated drafts or update existing ones
Version control: Compare different draft approaches before submitting

Solution 5: Status Tracking with Visual Timeline
Maps to Blueprint: Step 9 (Track Status)
BD - Regional Manager
Track progress: view approval state and reviewer

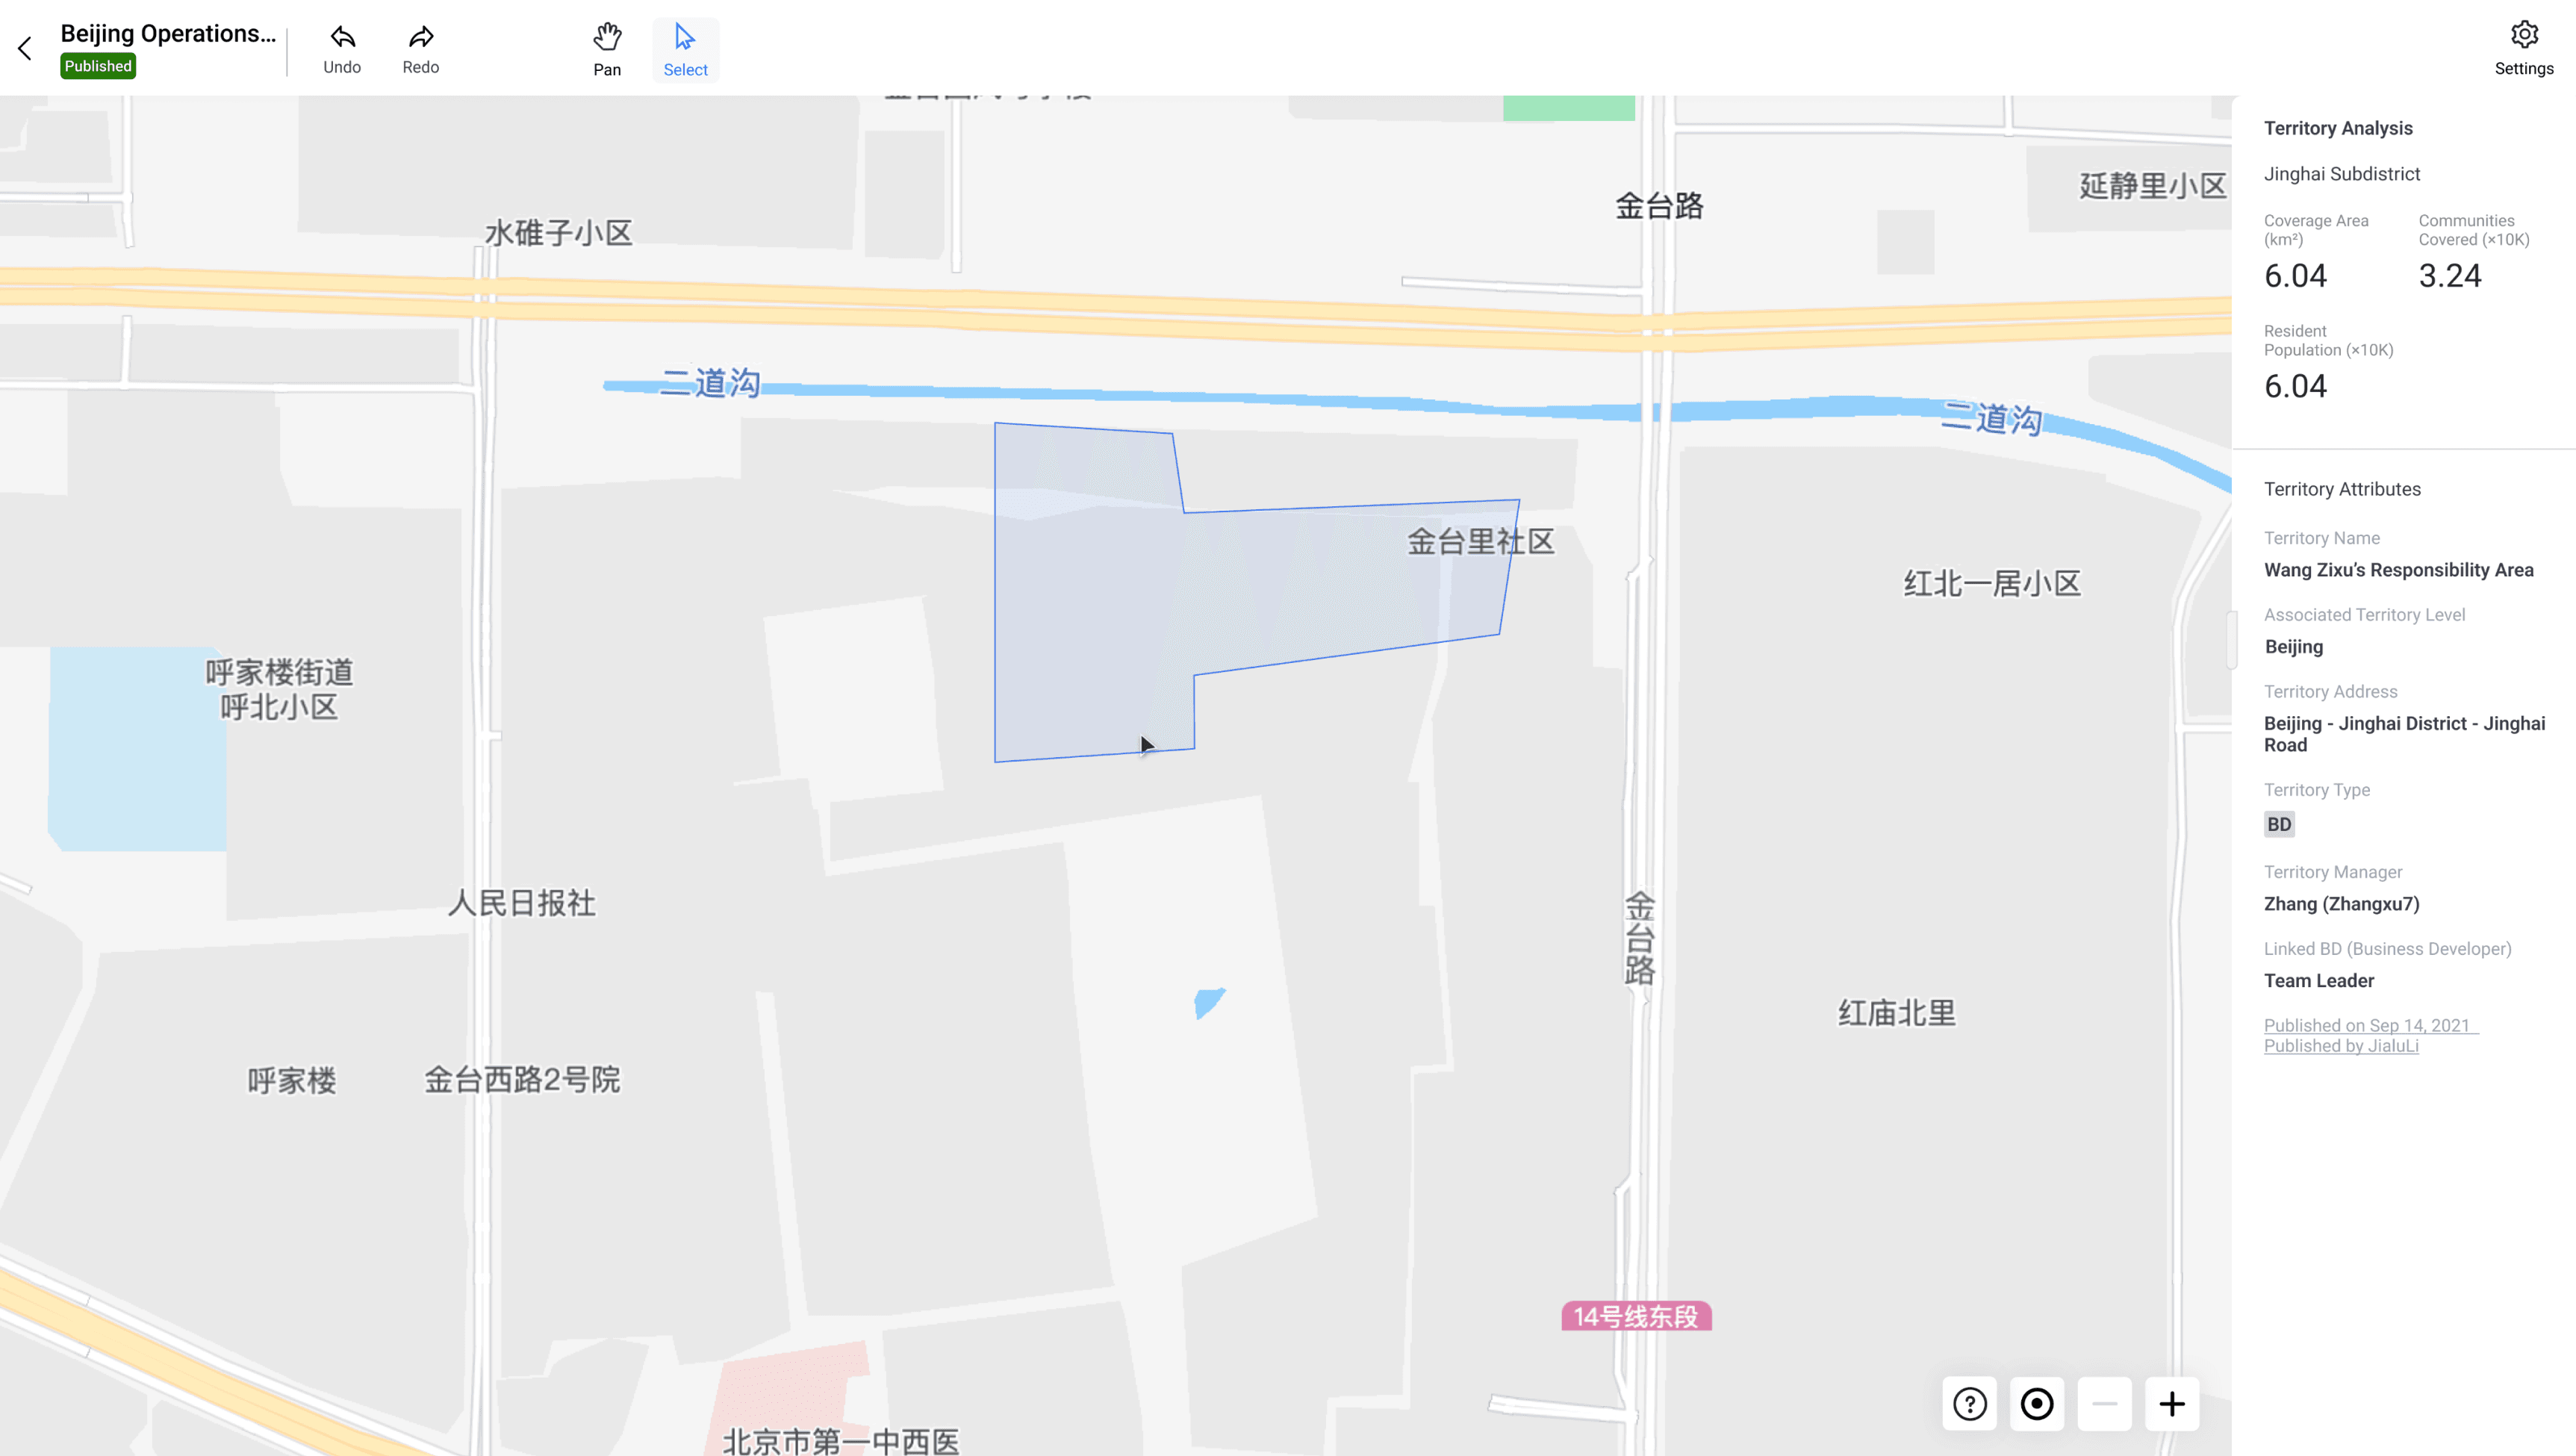
Solution 6: Franchise Owner View
Maps to Blueprint: Step 10 (View Results) - Owner role

Franchise Owner / Agent
Understand service boundaries, coverage, and reporting structure
Results & Impact
60%
Time reduction per map
From 2-3 hours → ~1 hour
8 → 20+
Provinces covered
System became foundation for new subsidiary
Efficiency Impact
Business Expansion
Full launch | 1 month design → 1 quarter dev

Related Projects


